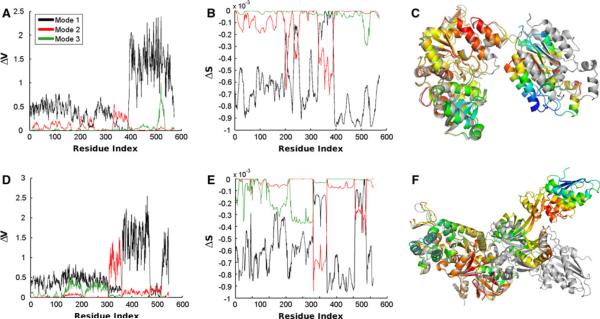
Fig. 2.
Comparison of the change in energy and entropy upon deformation by the first three normal modes. a–c Data is shown for the ATP sulfurylase structure 1I2DA. c We show the entropic change on the structure corresponding to mode 1. Coloring is spectral from red, to yellow, to green, and finally to blue. The red parts correspond to zero and blue parts to the largest change in entropy. The structure 1M8PA is shown in gray. This structure pair is the most similar of the five. Parts d–f are similar to a–c, but for the elongation factor 2 structures and in f is shown the structure pair 1N0VC. This structure pair has the largest total RMSD of the five pairs

