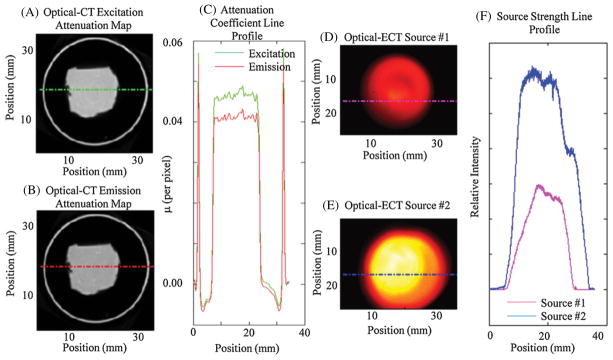
Figure 5.
(A) and (B) The excitation and emission attenuation maps. The rings surrounding the inked core are edge artifacts representing the boundary of the phantom which are common to optical-CT images. (C) The line profile accompanying the red dashed line on the attenuation maps showing a higher attenuation coefficient for the lower wavelength photons with noticeable edge artifacts (e.g. rings surrounding the inked core). (D) and (E) The source strength maps acquired to model the variation in source strength over the emission projections. (F) The corresponding line profiles in (D) and (E). The data from (A), (B), (D) and (E) represent the input data at which the reconstructed slice shown in figure 6 was utilized for reconstruction.

