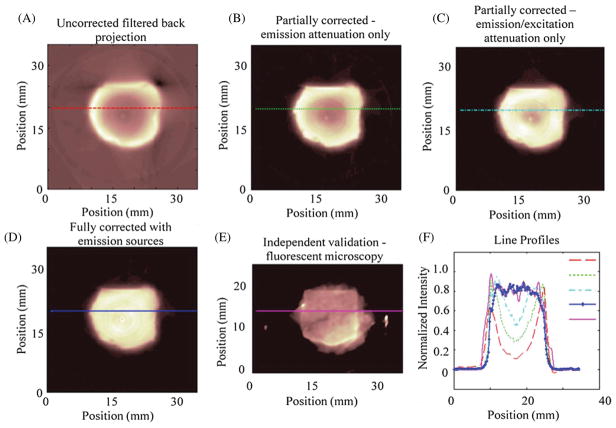
Figure 6.
(A) An uncorrected image reconstructed using filtered back projection. (B) An emission attenuation corrected image. (C) An excitation and emission corrected image assuming uniform source strength. (D) An excitation and emission corrected image with measured source strengths also modeled. (E) A verification image of a sectioned slice taken with a fluorescent dissecting microscope showing the actual fluorophore distribution within the sample. (E) A plot of the line profiles through the lines on the images (A)–(E). Notice the significant depressions that result from incomplete modeling of the imaging system.

