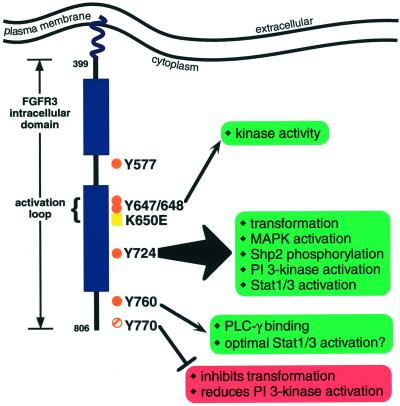
Figure 11.
Model of FGFR3 tyrosine residues and their role in signal transduction. The intracellular domain of FGFR3 is depicted, with the approximate locations of tyrosine residues examined in this study indicated by orange dots (solid dots indicate autophosphorylation sites; striped dot indicates a conserved tyrosine residue). The arrows pointing to green boxes indicate the FGFR3 responses that require those tyrosine residues. The red box associated with Y770 indicates those pathways that are negatively influenced by Y770.

