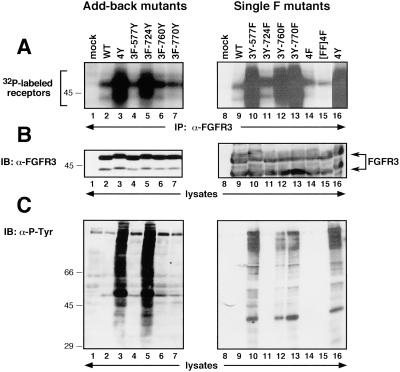
Figure 3.
In vitro and in vivo kinase activity of FGFR3 Add-back and Single F derivatives. (A) In vitro kinase assay of FGFR3 derivatives. (B) FGFR3 expression levels were similar in each sample, as determined by immunoblotting of whole-cell lysates. (C) Tyrosine-phosphorylated proteins in cells expressing FGFR3 constructs. Molecular weight markers are indicated in kilodaltons.

