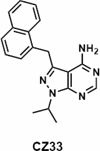
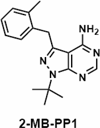
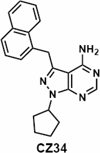
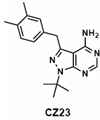
Table 3.
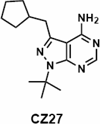
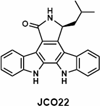
IC50 values for CpCDPK1 inhibitors tested.
| Compound | IC50 (nM) |
|---|---|
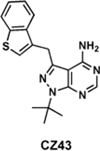 |
1.3 ± 0.2 |
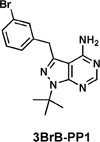 |
2.1 ± 0.2 |
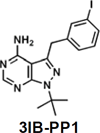 |
2.1 ± 0.3 |
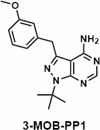 |
2.8 ± 0.2 |
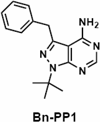 |
3.4 ± 0.1 |
 |
3.4 ± 0.1 |
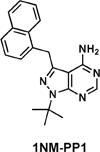 |
0.9 ± 0.1 |
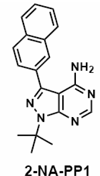 |
2.6 ± 0.1 |
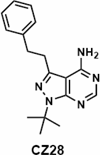 |
4.7 ± 0.4 |
 |
7 ± 0.2 |
 |
5.6 ± 0.5 |
 |
15.2 ± 4.4 |
 |
5.6 ± 0.8 |
 |
7.7 ± 1 |
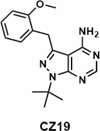 |
22 ± 2 |
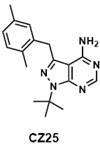 |
249 ± 73 |
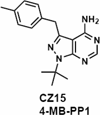 |
96 ± 13 |
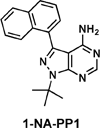 |
88 ± 0.14 |
 |
616 ± 203 |
 |
2722 ± 72 |
All compounds were tested using 500 μM ATP and 500 μM Syntide2 as described in Methods. A concentration range from 1 nM to 1 μM for all compounds was used except for CZ25, CZ15 and 1nA-PP1 (2 nM to 2 μM), CZ27 (4 nM to 4 μM) and JC022 (8 nM to 8 μM).
