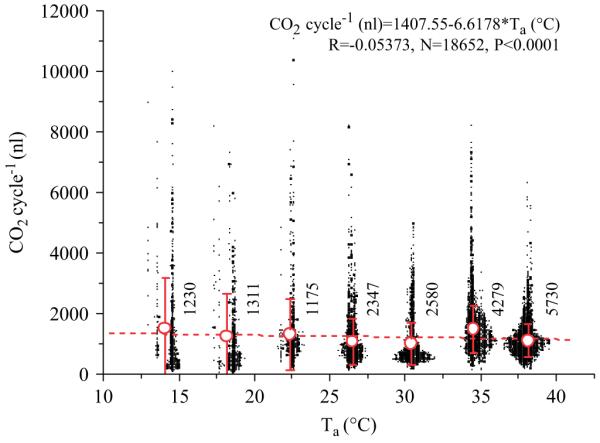
Fig. 7.

CO2 released per cycle in resting honeybees (black symbols, overlapping values shifted horizontally) at different ambient temperatures (Ta). Circles indicate mean with SD, numbers indicate cycles.

CO2 released per cycle in resting honeybees (black symbols, overlapping values shifted horizontally) at different ambient temperatures (Ta). Circles indicate mean with SD, numbers indicate cycles.