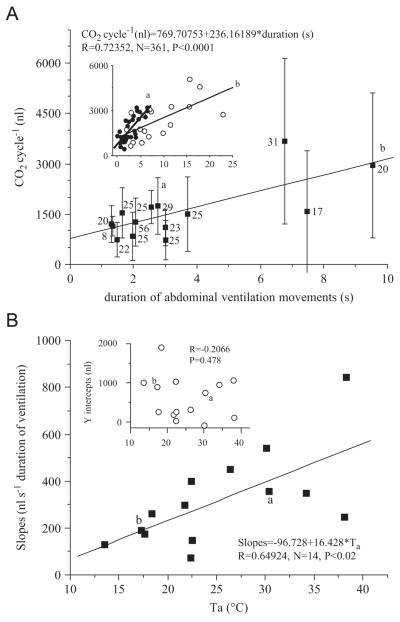
Fig. 9.
(A) CO2 emission per cycle of resting honeybees as a function of duration of abdominal ventilation movements (means of individual bees with SD). Inset shows samples of the relation in individual bees at 30 °C (a) and 17 °C (b). Numbers indicate N. (B) Slopes (main graph) and y intercepts (inset) of the dependence of CO2 emission per cycle on ventilation duration of individual bees from A in dependence on ambient temperature (Ta). a and b indicate origin of sample curves in A (inset).

