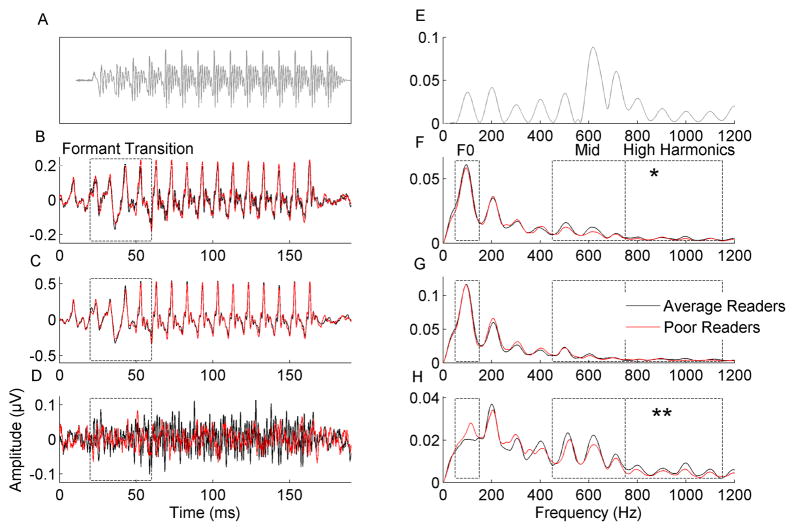
Figure 1. Poor readers have reduced representation of higher harmonics when stimulus fine structure is preserved in the response.
A. Time-domain representation of the stimulus (gray) has been shifted in time for visual purposes to reflect the neural conduction lag. B. Responses for average readers (black) and poor readers (red) to a Single Polarity of the stimulus. C. Responses for average and poor readers when using the Add technique (adding responses to alternate polarities). D. Responses for average and poor readers when using the Subtract technique (subtracting responses to alternate polarities). The entire response waveforms are plotted and the spectral analysis window (20–60 ms) is marked with hashed lines. E. The stimulus spectrum (gray) shows greater energy in the higher harmonics than the fundamental frequency (F0). F. Compared to average readers (black), poor readers (red) trend towards weaker encoding of High Harmonics in response to a Single Polarity. G. Average and poor readers do not differ in their representation of harmonics when using the Add technique. H. Poor readers have significantly weaker representation of the High Harmonics when using the Subtract technique. No group differences were found for the F0 in any condition. F0 (50–150 Hz), Mid Harmonics (450–750 Hz), and High Harmonics (750–1150 Hz) analysis regions are marked by boxes. Due to the phase locking limits of the auditory brainstem, spectral energy is plotted up to 1200 Hz only despite the presence of higher speech formants in the stimulus. Note: Given the nature of the processing methods and the phase-locking properties of the auditory brainstem, response amplitudes to a Single Polarity and when using the Add technique (B, C, F, G) are much larger than amplitudes when using the Subtract method (D, H). In order to visualize group differences regardless of overall amplitude, the y-axis limits in each panel were scaled to 110% of the largest amplitude present for the average readers in each condition.
* p < 0.05, ** p < 0.005

