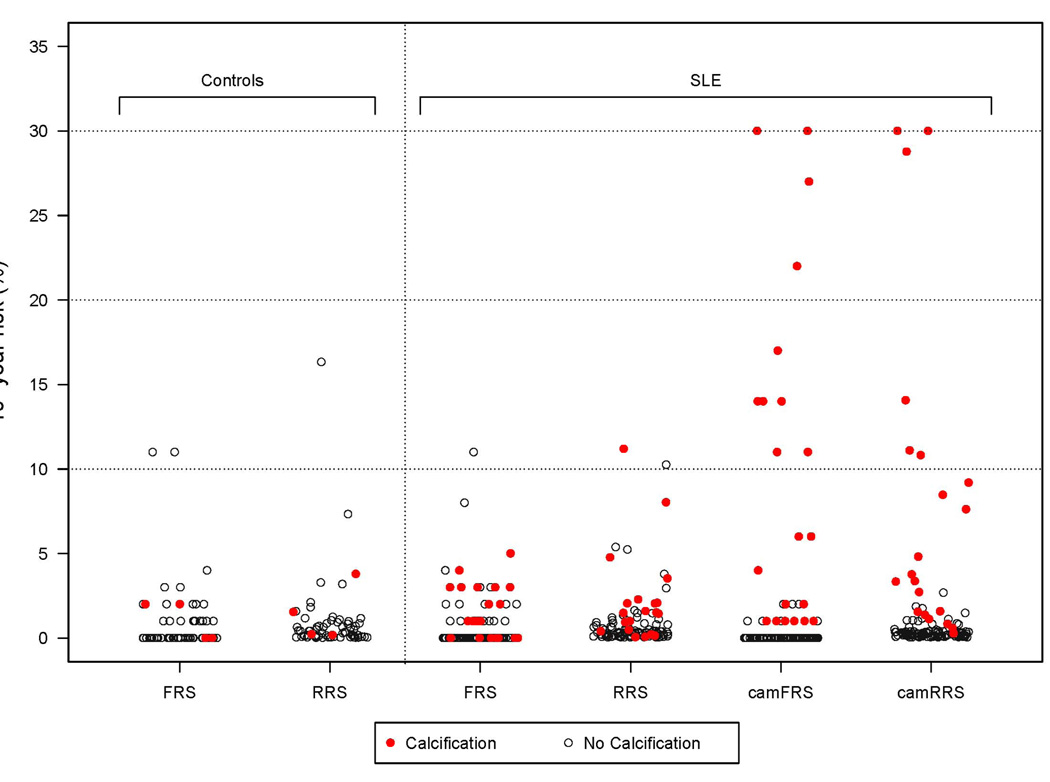
Figure 1. 10-year risk estimates (%) in women with SLE and age-matched controls.
Subjects with coronary calcium are represented by red filled circles, and those without coronary calcium are represented by black empty circles. FRS= 10-year Framingham risk score; RRS: 10-year Reynolds risk score; camFRS: coronary age-modified FRS; cam-RRS: coronary age-modified RRS.

