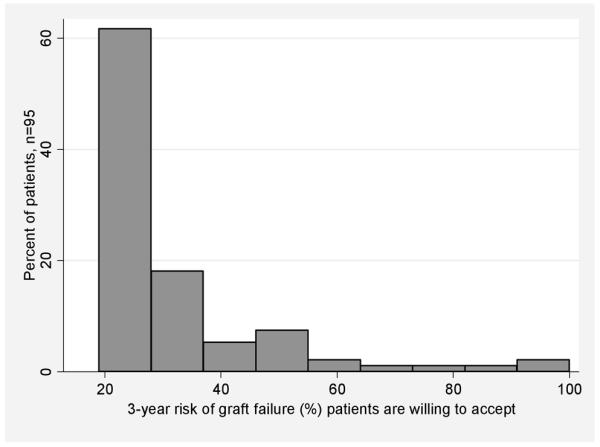
Figure 2.

Histogram demonstrating variability between patients in terms of the 3-year risk of graft failure they are willing to accept. Preferences displayed are those given by patients after they had opportunity to reflect upon the implications for organ availability (pie chart in Figure 1).
