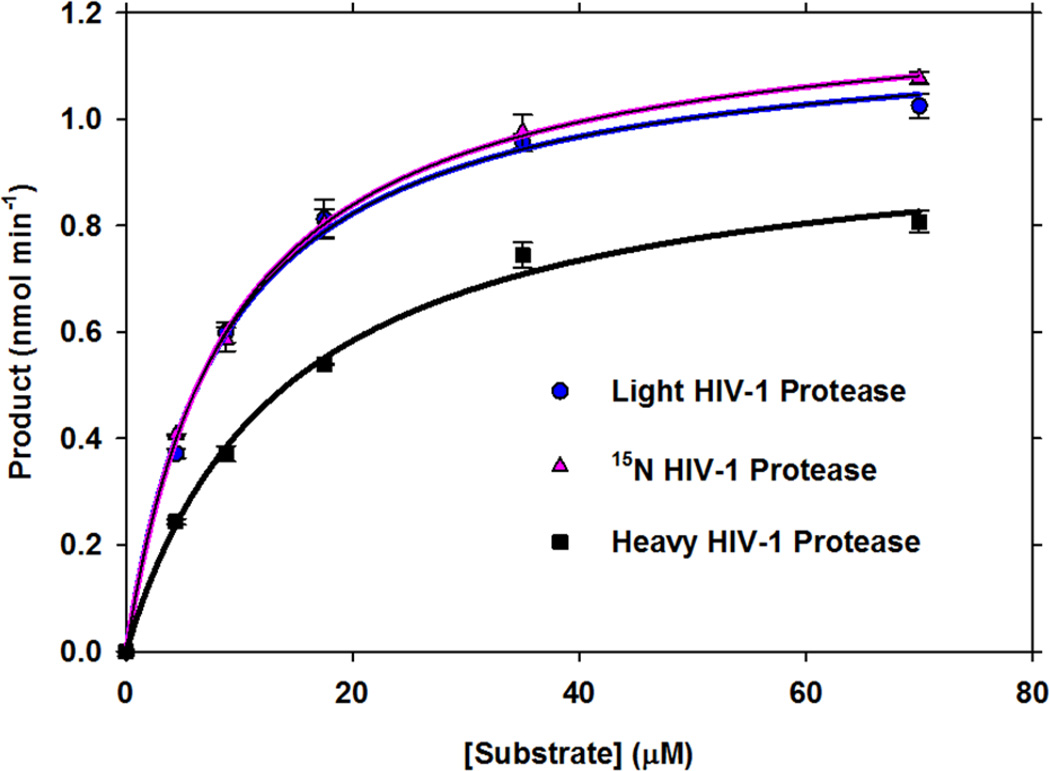
Figure 2.
Saturation kinetics of light, 15N-labeled and heavy HIV-1 protease. Steady state kinetic rates of product formation are plotted as a function of fluorescent substrate concentration. Catalysts are 10 nM light (blue), 15N (pink), and heavy (black) HIV-1 protease. Curves were plotted as a function of initial rate (vi) of product formation and substrate concentration and were fit to the equation vi = kcat[E][A]/(Km + [A]).

