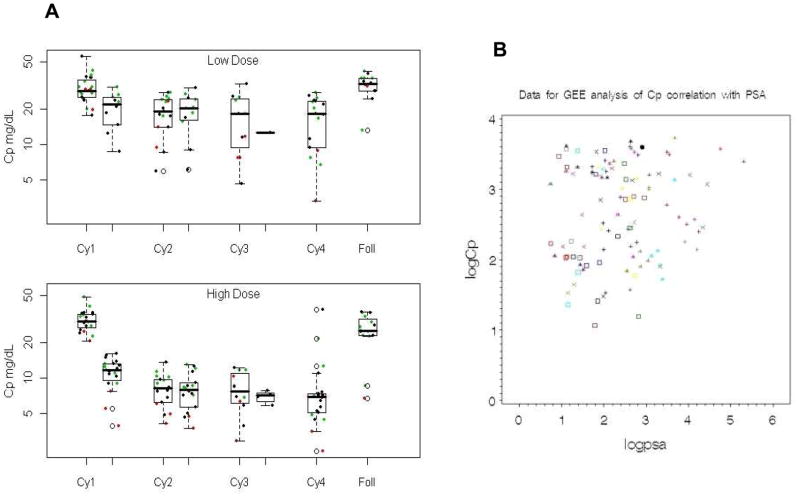
Figure 1.
Correlation of Cp levels and PSA levels. A: Changes of Cp according to the two ATN-224 dose-levels, in study participants. Boxplots of Cp by study arm, low-dose (30 mg) and high-dose (300 mg), across four treatment cycles and long-term follow-up are shown. The horizontal line inside each box represents the median Cp level. Green points represent patients from a higher Cp value site and red points are patients from a lower Cp value site. B: GEE analysis of correlation between Cp and PSA. Different symbols are for different patients. The overall p-value for the correlation of log(Cp) with log(PSA) for all patients with values on the same date is 0.16.

