
Figure 7. Lin28A and Lin28B expression in primary human cancers.
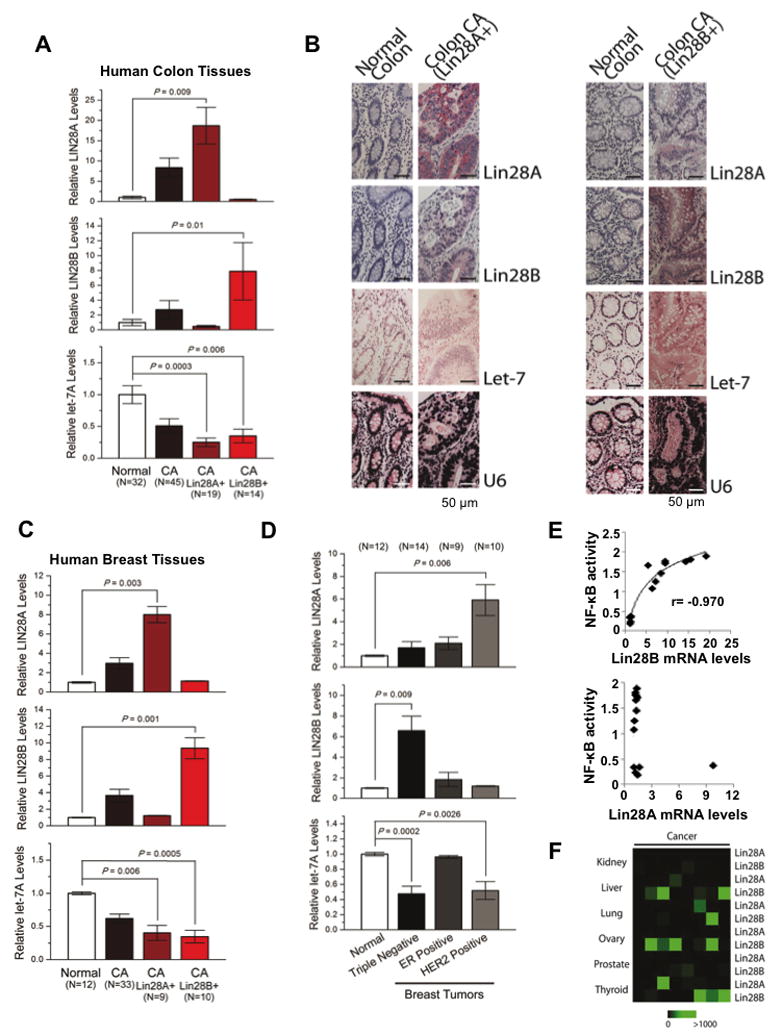
(A) q.RT-PCR analysis of Lin28A, Lin28B and let-7a expression levels in normal and colon cancer tissues. Tumor samples were further classified into two groups expressing either high Lin28A or Lin28B. Data expressed as mean ± SE. n=3. (B) Immunohistochemistry for Lin28A, Lin28B and in situ hybridization for let-7a and U6 in normal colon tissues and colon adenocarcinomas. See also Figure S4. (C) q.RT-PCR analysis of Lin28A, Lin28B and let-7a in human normal and breast cancer tissues. Tumor samples were further classified into two groups expressing either high Lin28A or Lin28B. Data expressed as mean ±SE. n=3. (D) Lin28A, Lin28B and let-7a expression levels in different breast cancer subtypes. (E) Correlation between Lin28A and Lin28B mRNA levels assessed by q.RT-PCR with NF-κB phosphorylation status assessed by ELISA assay. (E) Heatmap representation of Lin28A and Lin28B in carcinomas of different origin measured by q.RT-PCR.