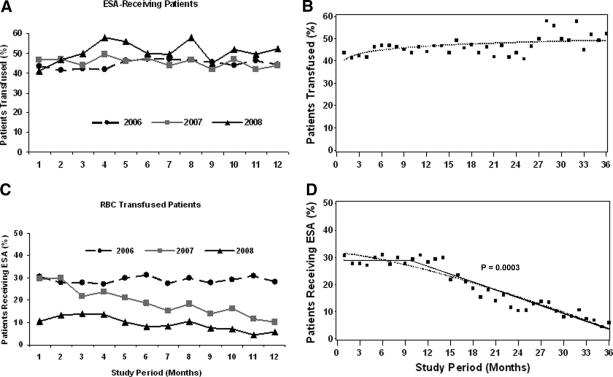
Figure 3.
Monthly use of RBC transfusions in erythropoiesis-stimulating agent (ESA)-receiving patients and ESAs in RBC-transfused patients for 2006–2008. On the left, the proportion of ESA-receiving patients who required RBC transfusions (A) and the proportion of RBC-transfused patients who received ESAs (C) are shown. On the right, results of the corresponding piecewise linear regression model for the proportion of patients transfused (B) and patients receiving ESAs (D) are shown.

