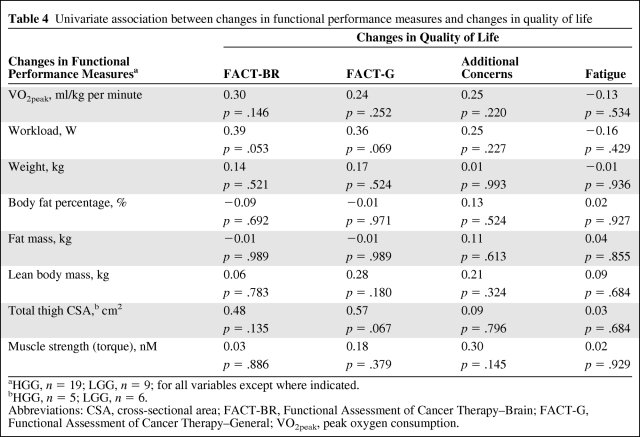
Table 4.
Univariate association between changes in functional performance measures and changes in quality of life
aHGG, n = 19; LGG, n = 9; for all variables except where indicated.
bHGG, n = 5; LGG, n = 6.
Abbreviations: CSA, cross-sectional area; FACT-BR, Functional Assessment of Cancer Therapy–Brain; FACT-G, Functional Assessment of Cancer Therapy–General; VO2peak, peak oxygen consumption.

