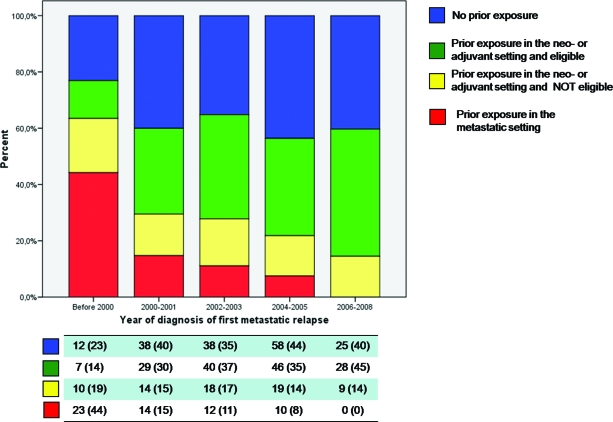
Figure 2.
Proportion of patients fulfilling each definition for eligibility or noneligibility for treatment with anthracyclines for metastatic disease by year of diagnosis of first metastasis. Below each bar of the graph is summarized, by each time period, the number of patients in each category of eligibility. Numbers in parentheses represent column percentages.

