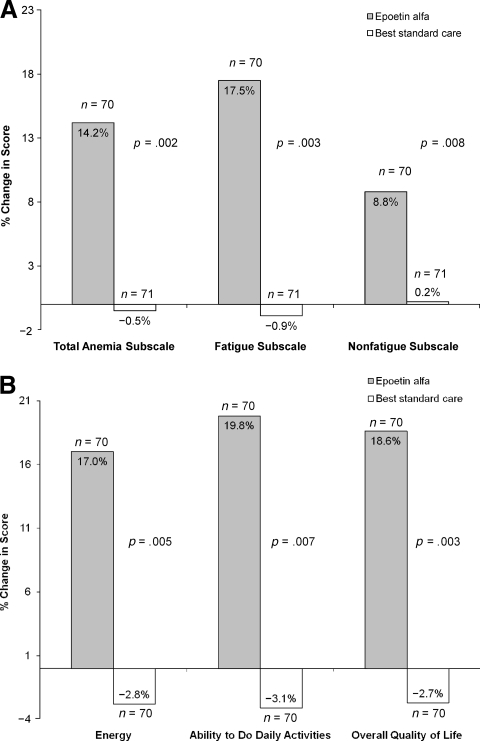
Figure 2.
Comparing patient-reported outcomes between epoetin alfa treatment and best standard care. (A): Percent change in mean FACT-An subscale scores between baseline and week 12 (mITT population). (B): Percent change in mean CLAS score between baseline and week 12 (mITT population).
Abbreviations: CLAS, Cancer Linear Analog Scale; FACT-An, Functional Assessment of Cancer Therapy–Anemia; mITT, modified intention-to-treat.

