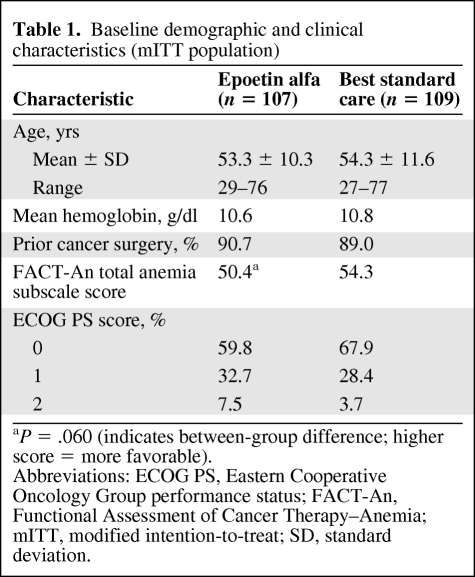
Table 1.
Baseline demographic and clinical characteristics (mITT population)
aP = .060 (indicates between-group difference; higher score = more favorable).
Abbreviations: ECOG PS, Eastern Cooperative Oncology Group performance status; FACT-An, Functional Assessment of Cancer Therapy–Anemia; mITT, modified intention-to-treat; SD, standard deviation.

