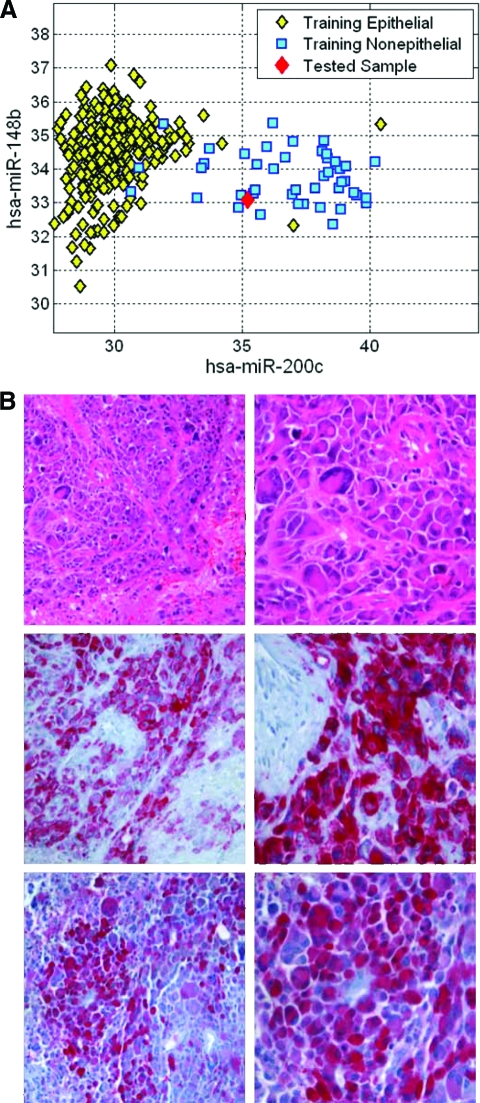
Figure 3.
Classification example. (A): Measured levels (normalized CT, inversely proportional to log(abundance)) of hsa-miR-200c and hsa-miR-148b are compared for all training set samples and the tested sample. (B): Hematoxylin and eosin staining (upper panel) showed that the metastasis was composed of undifferentiated pleomorphic tumor cells. These reveal focally strong and specific immunopositivity for S100 (lower panel) and HMB45 (middle panel).
Abbreviation: CT, cycle threshold.

