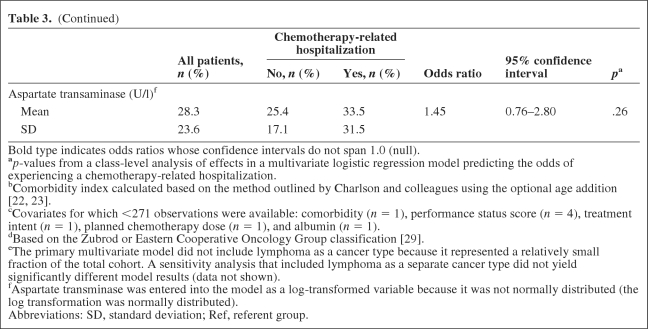
Table 3.
(Continued)
Bold type indicates odds ratios whose confidence intervals do not span 1.0 (null).
ap-values from a class-level analysis of effects in a multivariate logistic regression model predicting the odds of experiencing a chemotherapy-related hospitalization.
bComorbidity index calculated based on the method outlined by Charlson and colleagues using the optional age addition [22, 23].
cCovariates for which <271 observations were available: comorbidity (n = 1), performance status score (n = 4), treatment intent (n = 1), planned chemotherapy dose (n = 1), and albumin (n = 1).
dBased on the Zubrod or Eastern Cooperative Oncology Group classification [29].
eThe primary multivariate model did not include lymphoma as a cancer type because it represented a relatively small fraction of the total cohort. A sensitivity analysis that included lymphoma as a separate cancer type did not yield significantly different model results (data not shown).
fAspartate transminase was entered into the model as a log-transformed variable because it was not normally distributed (the log transformation was normally distributed).
Abbreviations: SD, standard deviation; Ref, referent group.

