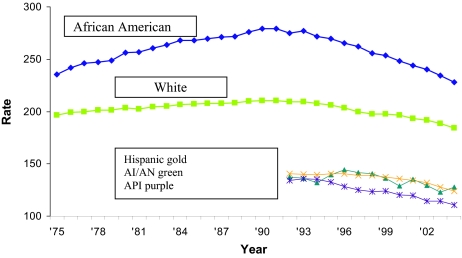
Figure 1.
Cancer mortality rates 1973–2004 by race. Incidence and mortality rates per 100,000 and age-adjusted to the 2000 U.S. standard population. Surveillance, Epidemiology, and End Results Cancer Statistics Review 1975–2004.
Abbreviations: AI/AN, American Indian/Alaska Native; API, Asian or Pacific Islander.

