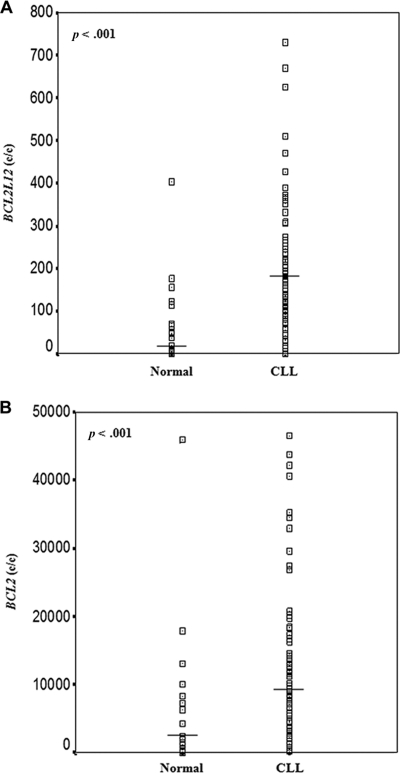
Figure 2.
Distribution of BCL2L12 (A) and BCL2 (B) mRNA expression in the cohorts of non-leukemic population and CLL patients. The line bars represent the median value (50th percentile) for each patient cohort. BCL2L12 and BCL2 mRNA expression levels were higher in CLL patients than in healthy controls. The p-values were calculated using the Mann-Whitney U test. Abbreviation: CLL, chronic lymphocytic leukemia.

