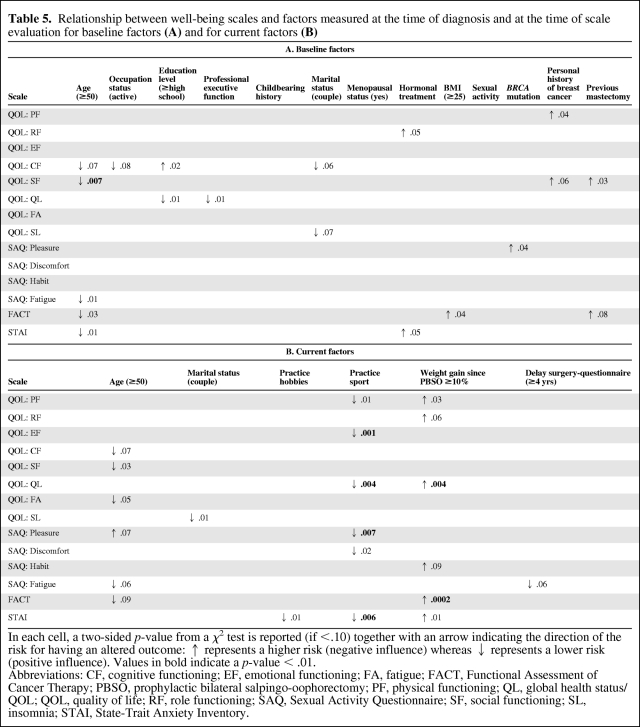
Table 5.
Relationship between well-being scales and factors measured at the time of diagnosis and at the time of scale evaluation for baseline factors (A) and for current factors (B)
In each cell, a two-sided p-value from a χ2 test is reported (if <.10) together with an arrow indicating the direction of the risk for having an altered outcome: ↑ represents a higher risk (negative influence) whereas ↓ represents a lower risk (positive influence). Values in bold indicate a p-value < .01.
Abbreviations: CF, cognitive functioning; EF, emotional functioning; FA, fatigue; FACT, Functional Assessment of Cancer Therapy; PBSO, prophylactic bilateral salpingo-oophorectomy; PF, physical functioning; QL, global health status/QOL; QOL, quality of life; RF, role functioning; SAQ, Sexual Activity Questionnaire; SF, social functioning; SL, insomnia; STAI, State-Trait Anxiety Inventory.

