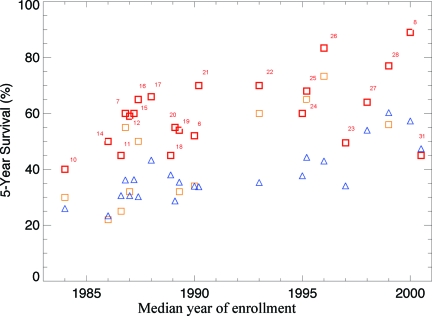
Figure 2.
The 5-year survival rate of patients participating in clinical trials (squares) and age-adapted survival for patients in the Surveillance, Epidemiology, and End Results database diagnosed in the same time period as patients in the related clinical trial (triangles) are shown. In trials in which there was a difference in survival between arms of the trial, the higher survival rate is given as a thicker, red square; the lower survival rate is shown as a lighter, orange square. Reference numbers for the relevant trial are given next to the red squares.

