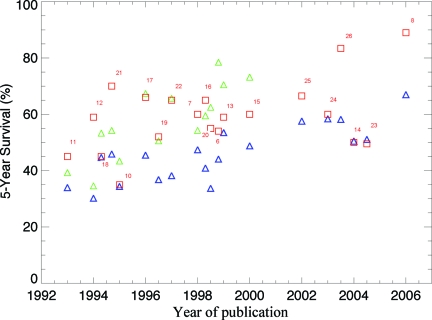
Figure 3.
The 5-year survival rate of patients participating in clinical trials (squares) and the age-adapted survival rate for patients in the Surveillance, Epidemiology, and End Results database for the 5 years prior to and including the year of publication of the relevant trial (blue triangles) and the 5 years following publication of the relevant trial (green triangles) are shown. If survival differed in different arms of the clinical trial, the arm with the best survival was used. Reference numbers for the relevant trials are included next to squares representing trials.

