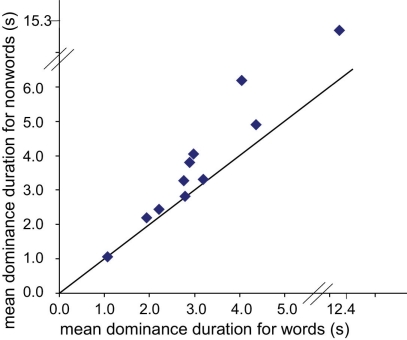
Figure 3.
Scatter plot showing mean dominance durations of non-words vs. words for each subject. All points are on or above the equivalence line: mean dominance durations for non-words were longer than for words. Note one observer had considerably longer dominance durations, plotted on an extended scale.

