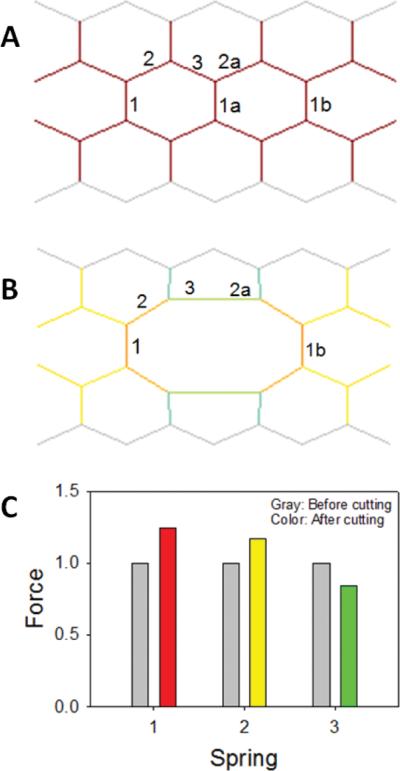
FIGURE 1.

A small hexagonal network (A and B) and the distribution of normalized mechanical forces (C) on the network elements before (A) and after (B) mechanical failure. Springs are labeled with numbers. On (B) spring 1a is missing and the network was solved for its equilibrium configuration using simulated annealing. The color inside the network is proportional to force carried by the springs. See text for further explanation. Modified with permission from B. Suki.54
