Figure 2.
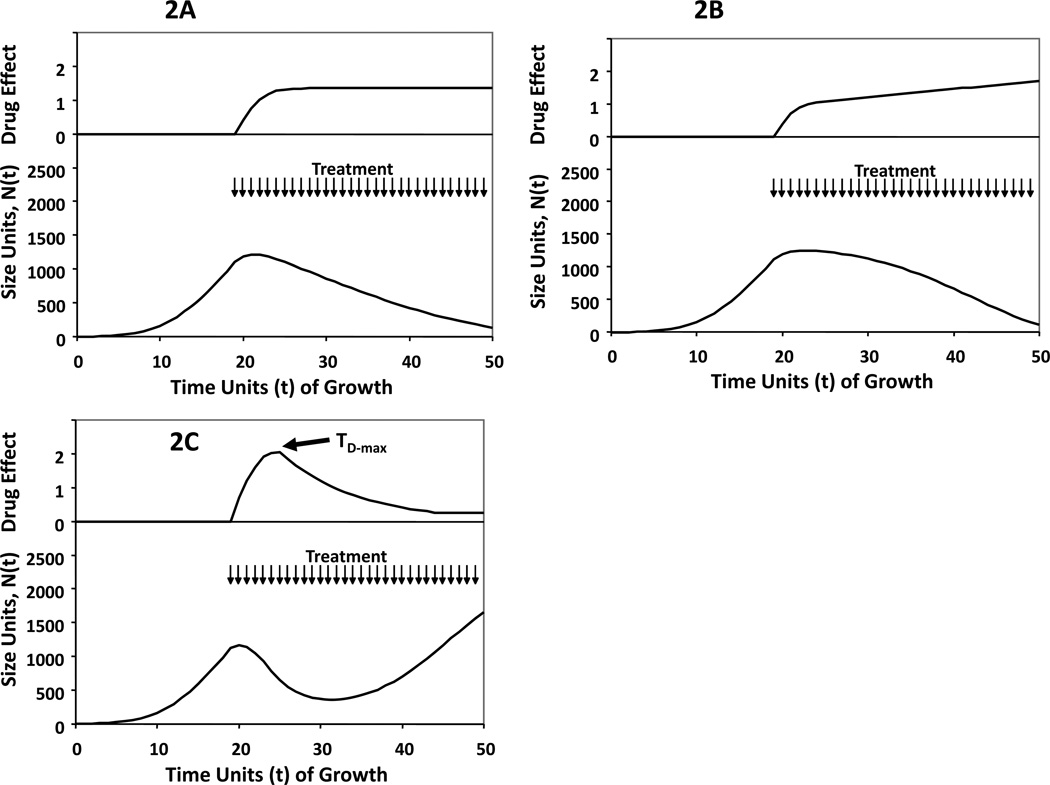
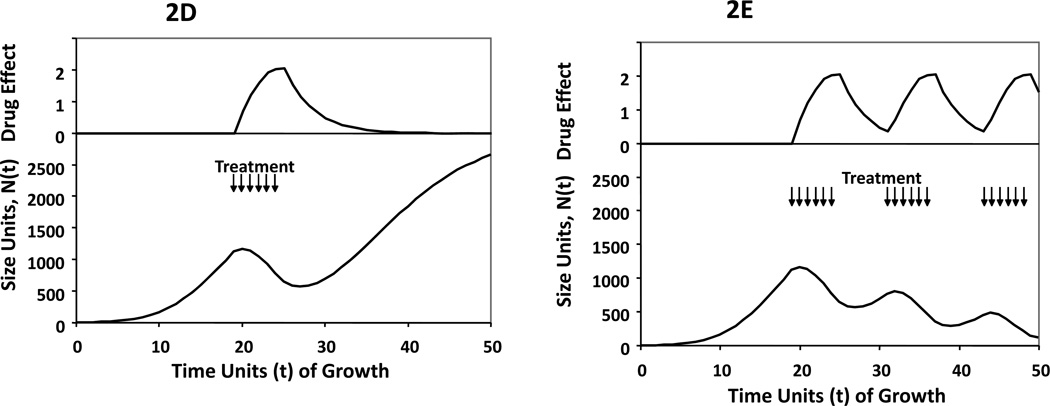
Conceptual sketches of Gompertzian growth curves in response to treatment, illustrating proposed patterns of drug effect (2A, 2B and 2C). The top panels of each curve demonstrate the magnitude of drug effect over time, as calculated by measuring at each time point after the initiation of therapy, the value of one minus the ratio of the Gompertzian growth rate of the tumor in the treated state with that estimated from data that would be observed for a tumor of that size in the control state. Panels 2D and 2E represent the theoretical impact of treating to the point of maximal drug effect if response to therapy mimics scenario 2C. Treatment is signified by arrows at times of administration.
2A: Gompertzian growth perturbed by effective continuous treatment in a case where the efficacy of therapy D(t) increases to a stable plateau greater than zero.
2B: Gompertzian growth perturbed by effective continuous treatment in a case where the efficacy of therapy D(t) increases consistently as long as the treatment continues.
2C: Gompertzian growth perturbed by effective continuous treatment in a case where the efficacy of therapy D(t) increases to a peak, then decreases as treatment continues beyond the time of that peak, TD-max. In this case, D(t) remains greater than zero even for t > TD-max, so treatment is slowing growth but not causing tumor regression. That is, dD(TD-max)/dt = 0. In this case, we propose the best way to schedule drug would be continuous dosing between TRx and TD-max, then discontinuation.
2D: Gompertzian growth perturbed by effective treatment that is discontinued after TD-max. There is an exponentially declining D(t) after treatment discontinuation.
2E: Gompertzian growth perturbed by effective intermittent treatment where drug administration ends at the point of maximum drug effect. The length of each therapy cycle is constant, TD-max – TRx as guided by Figure 2C.


