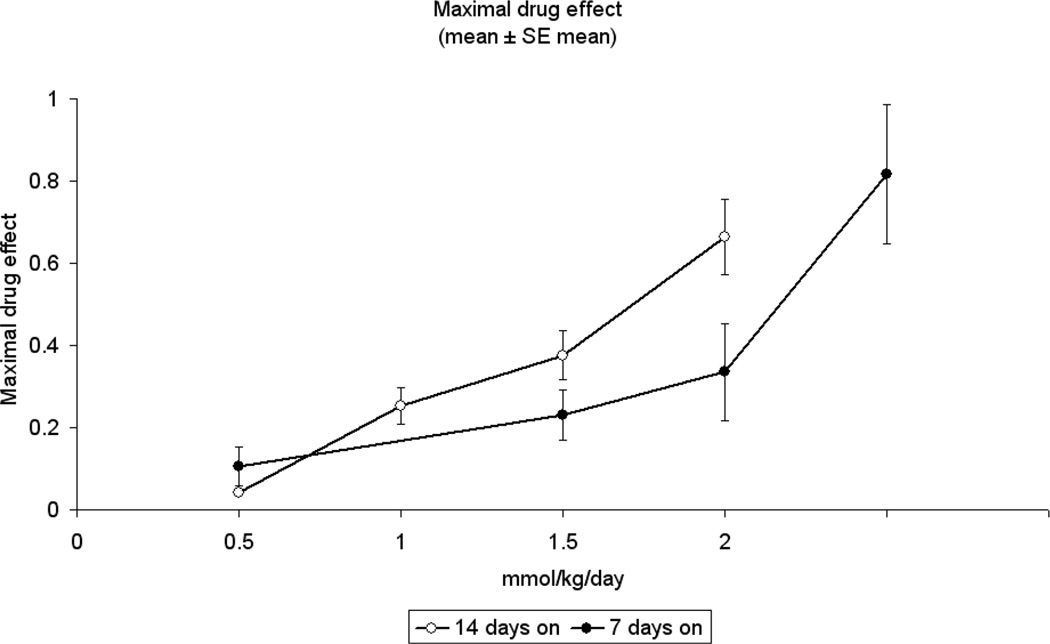
Figure 8.
The maximal drug effect is summarized for KPL4 xenografts when given capecitabine at increasing doses. The solid circles represent the 7—7 schedule; open circles represent control (14—7). Capecitabine at 2.5mmol/kg/day was not deliverable at the 14—7 schedule due to mortality for study mice.

