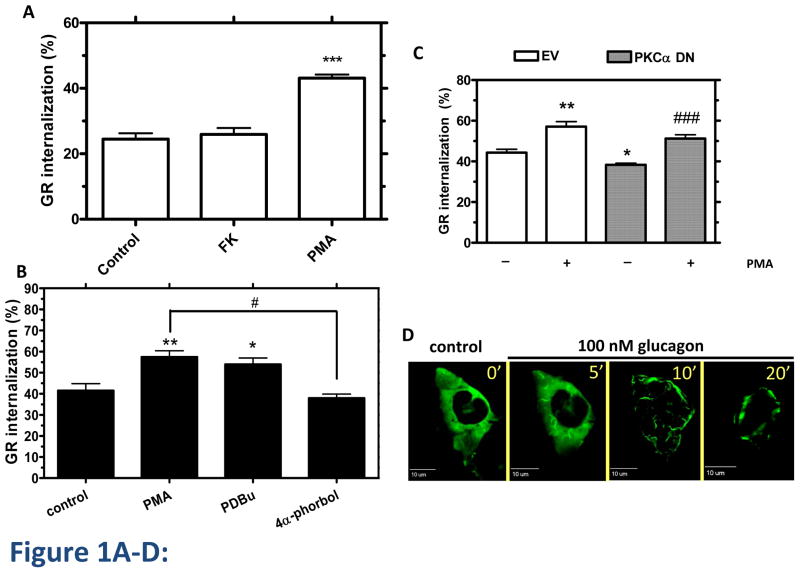
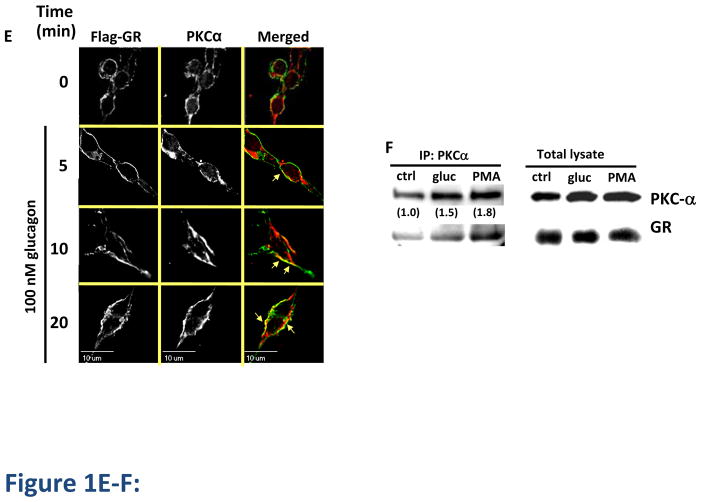
Figure 1. Involvement of PKC-α in GR internalization.
A, HEK-GR cells were serum-starved and incubated without (control) and with 200 nM PMA or 1 μM Forskolin (FK) plus 25 μM IBMX for 30 min, followed by 30 min incubation with 100 nM glucagon. GR internalization was determined by binding (Method A). Data represent the mean ± s.e.m. of 6 experiments. ***, p < 0.001, glucagon vs. glucagon+PMA. B, HEK-GR cells were serum-starved for 1 h and incubated without (control) and with 200 nM PMA, 1 μM phorbol-12-13-dibutyrate (PDBu), or 4α-phorbol for 15 min, followed by 30 min incubation with 100 nM glucagon. The internalization was determined by binding (Method B). Data represent the mean ± s.e.m. of 3 experiments. *, p < 0.05 vs. control, **; p < 0.01 vs. control; #, p < 0.05, 4α-phorbol vs. PMA. C, HEK-GR cells were transfected with dominant negative (DN) PKCα (checkered bars) or empty vector (EV; white bars). The cells were serum-starved for 1 h, incubated in the absence (−) or presence (+) of 200 nM PMA, and treated with 100 nM glucagon for 30 min. The GR internalization was determined by binding (Method A). Data represent the mean ± s.e.m. of 4–6 experiments. *, p < 0.05 vs. EV (−); **, p < 0.01 vs. EV (−); ###, p < 0.001 vs. PKCα DN (−). D, HEK-GR cells were transfected with PKCα-YFP and seeded onto glass-bottom 35-mm dishes. The cells were serum-starved for 1h and then treated with 100 nM glucagon. Translocation of PKCα-YFP was observed by time-lapse fluorescence microscopy. The cells were maintained on a heated stage during the time-lapse experiment. Images were taken at 0.5–2 minute intervals. Each fluorescence image is a deconvolved projection of 5–6 planes acquired using a 60 × objective. Data shown are representative of 3 independent experiments. E, HEK-FLAG-GR cells grown on coated glass coverslips were treated with 100 nM glucagon for the time indicated. The cells were then fixed, permeabilized and immunostained with anti-FLAG (green) and anti-PKCα (red) antibodies. Each fluorescence image is a deconvolved projection of 5–6 planes acquired using a 60 × objective. Representative images from 3 independent experiments are shown. Arrows indicate colocalization. F, HEK-FLAG-GR cells were incubated without (ctrl) or with either 100 nM glucagon (gluc) or 200 nM PMA for 30 min. Immunoprecipitation of PKCα and immunoblotting were performed as described in Materials and Methods. The mean values within parentheses represent the fold increase above control determined in the absence of either glucagon or PMA. The value for control was arbitrarily set as 1. The image shown is representative of 3 independent experiments.


