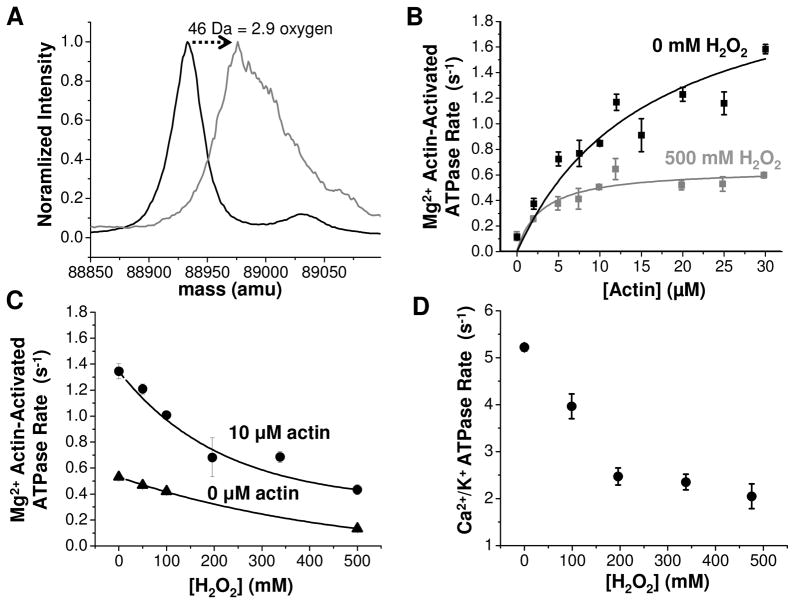
Fig. 2.
A. ESI-MS of intact Dicty myosin. Deconvoluted mass spectra (normalized to maximum intensity) for 0 mM (black) and 500 mM (gray) peroxide. Peak full width at half maximum is 30 Da for 0 mM and 67 Da for 500 mM. B. Functional assays for the same samples. For 0 mM peroxide, Vmax= 2.3 ± 0.5 and KATPase = 16± 7. For 500 mM peroxide, Vmax= 0.65 ± 0.04 and KATPase = 3.0± 0.8. C. Peroxide dependence of actin-activated ATPase activity in the presence of 10 μM actin (●) and no actin (▲). D. High salt myosin ATPase activity.

