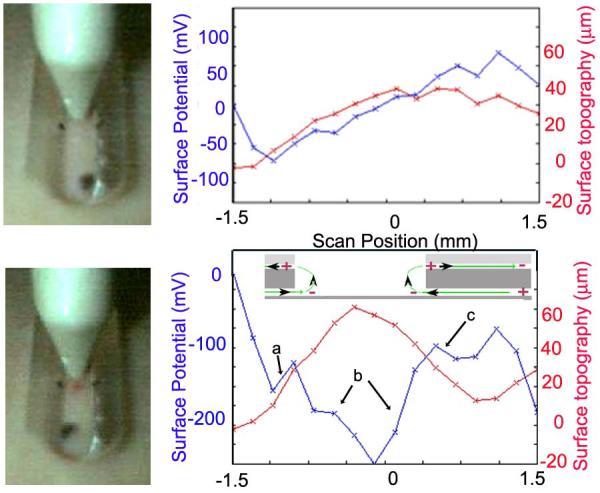
Figure 2.

Typical Dermacorder® scan of a 3 mm long region of a 42 year-old human forearm before (top) and after (bottom) making a 0.5 mm wide lancet wound. Measurements were made in 0.2 mm increments. The electric field in a given region is the slope of the curve there: region “a” =180 mV/mm, region “b”=160 mV/mm, region “c”=90 mV/mm. The largest change in potential was always found in region “b” and that is where we usually measured the electric field. Inset in the lower figure shows the wound current pattern leading to the surface potential pattern detected. Current flows away from the wound in the space between the epidermis and stratum corneum while current flows toward the wound within and beneath the epidermis.
