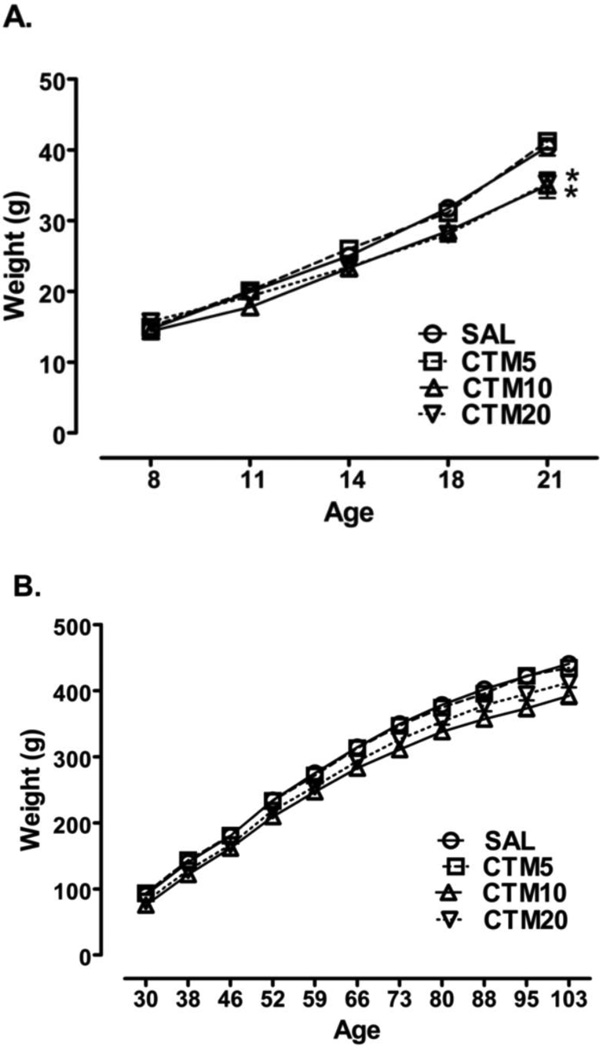
Figure 1.
Effects of neonatal citalopram dose on body weight. The body weight of neonatal exposure to SAL (n = 9), CTM5 (n = 14), CTM10 (n = 9) and CTM20 (n = 9) was assessed (a.) during the treatment exposure between PD8-21. (b.) following treatment exposure between PD30-100. Data represents the mean ± SEM. Two-way analysis of variance (ANOVA) with repeated measures followed by Bonferroni corrected t-test. (* P < 0.05).

