
Figure 1.
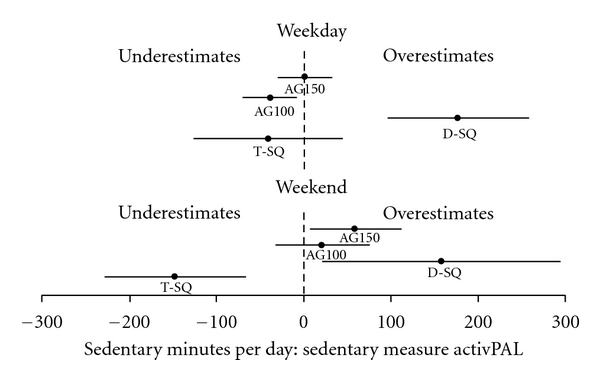
Illustration of the under- and overestimation of sedentary time for each measure compared to the activPAL monitor for (a) weekend (b) weekdays. The closed circles are the bias and the lines illustrate the 95% confidence intervals. AG100 refers to the ActiGraph cut-point of 100 counts·min−1, AG150 refers to the ActiGraph cut-point of 150 counts·min−1, T-SQ is a single-item total sedentary time questionnaire, and D-SQ is a 5-domain sedentary time questionnaire. Data includes 13 participants with valid data for all measures during both the baseline and intervention period.