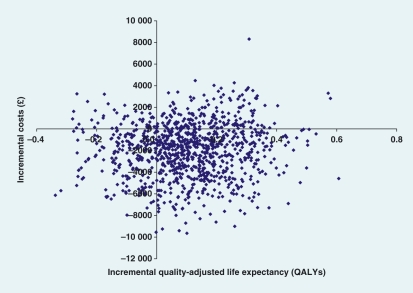
FIGURE 1.
Incremental cost-effectiveness ratio scatter plot for lispro vs. regular insulin. Base-case analysis incremental cost-effectiveness ratio scatter plot of 1000 values of mean incremental costs plotted against mean incremental effectiveness (quality-adjusted life years gained). The scatter plot was generated for Type 1 diabetes patients treated with a basal–bolus regimen of lispro vs. regular human insulin. The majority of incremental cost–effect pairs lie in the south-east quadrant, indicating dominance for lispro vs. regular human insulin, where lispro was projected to be more effective and cost saving.

