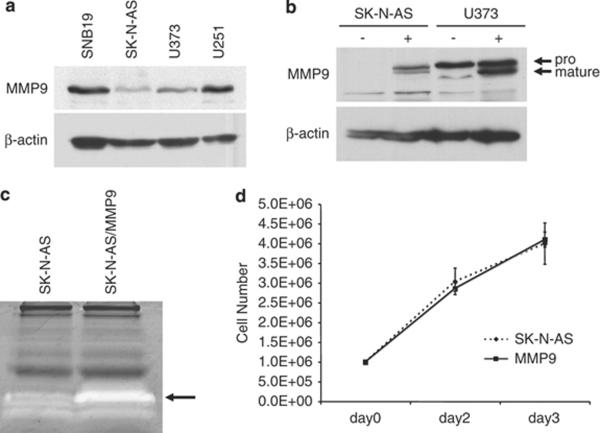
Figure 1. MMP-9 expression in brain tumor cell lines.
A. Western blot analysis of MMP-9 expression in brain tumor cell lines. β-actin was visualized as a loading control. B. MMP-9 levels in untransfected (−) and transfected (+) SK-N-AS and U373 cells. Arrows point to the pro (92 kD) and mature (88 kD) forms of MMP-9. C. Gelatin zymography of conditioned medium from untransfected and MMP-9 transfected SK-N-AS cells. White bands are indicative of gelatinase activity (arrow). D. Growth curves of untransfected and MMP-9 transfected SK-N-AS cells in culture. Equal numbers of cells were seeded, grown for 48 or 72h, and counted. Mean values of triplicates +/− SD.

