Fig. 2.
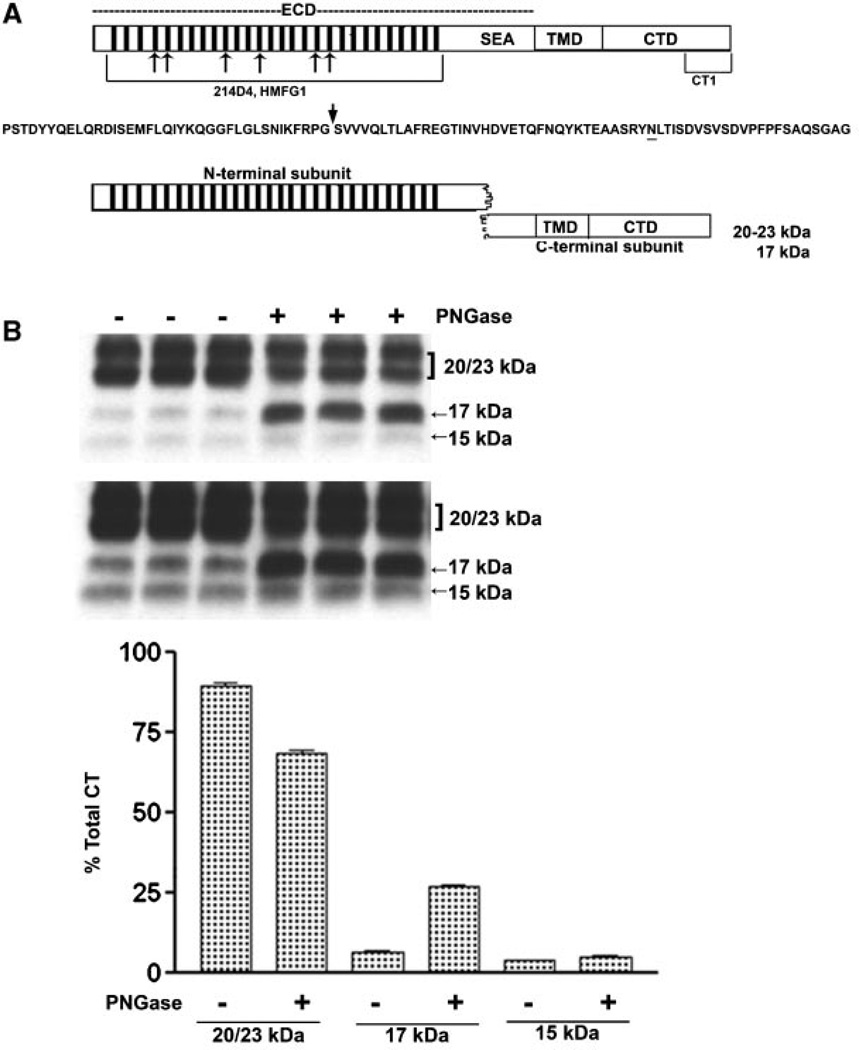
N-Deglycosylation of MUC1 CTD fragments. The upper portion of panel A presents a diagram of intact full length MUC1 as it would exist immediately after translation and designates the location of various domains: ECD, extracellular domain containing the tandem repeats (bars) and SEA module; TMD, the transmembrane domain; and CTD, the cytoplasmic tail domain. Also indicated are the locations of epitopes recognized by various antibodies used in the present study. Mouse monoclonal antibodies, 214D4 and HMFG1, both recognize epitopes within the tandem repeat regions indicated by the hatched bars in the figure and the bracket underneath in the model. The number of bars used is arbitrary and is not meant to indicate the precise number of tandem repeat motifs. Both antibodies would recognize the MUC1 N-terminal subunit and potentially bind to multiple sites in a single MUC1 molecule. Recognition by these antibodies is impacted by glycosylation. The CT-1 antibody was generated against the C-terminal 17 amino acid peptide of MUC1 and, therefore, only recognizes fragments of MUC1 containing all or part of this C-terminal sequence. There is no reported evidence that recognition bytheCT-1 antibody is impacted by post-translational modifications. Beneath is the amino acid sequence of the SEA module within the ECD. An arrow indicates the location of autoproteolytic cleavage which produces the N- and C-terminal subunits which reassociate to form the non-covalent heterodimeric “metabolic complex” diagrammed below. The N-glycosylation site is underlined and distinguishes the 20–23 kDa C-terminal subunit (N-glycosylated) from the 17 kDa C-terminal subunit (not N-glycosylated). In panel B lysates from cytokine plus 1 µM L685,458 treated HES cells were incubated without (−) or with (+) PNGase and subsequently analyzed by SDS–PAGE and Western blotting with CT1 antibody as described in “Experimental Procedures Section.” Two exposures are included to demonstrate CTF15. Densitometric analysis was based on the shorter exposure. Note that PNGase treatment resulted in a partial reduction of 20–23 kDa signal and accumulation of 17 kDa signal, however, there was no change in CTF15.

