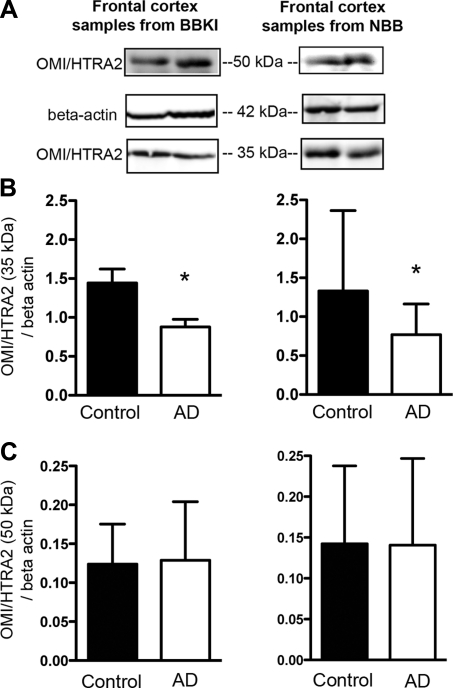
Figure 2.
Comparison of OMI/HTRA2 protein levels in frontal cortex of AD and controls from two separate sources: BBKI and NBB. S100 extracts were prepared from postmortem frontal cortex and probed with an OMI/HTRA2 antibody. A) Representative OMI/HTRA2 and β-actin immunoblots for AD and control brains. B, C) Quantification of 35 kDa (processed; B) and 50 kDa (unprocessed; C) OMI/HTRA2 normalized to β-actin. Values are means ± sd. *P < 0.05; Student's t test.

