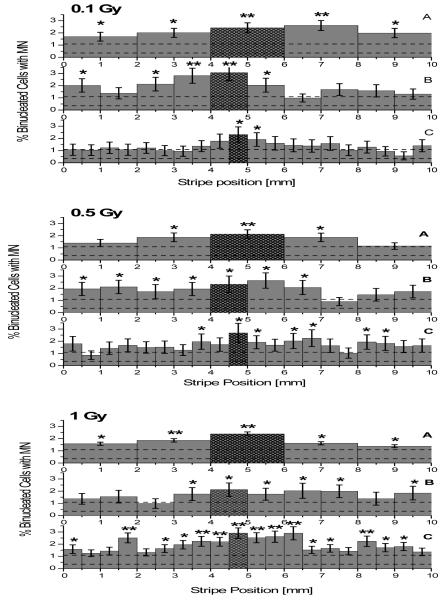
Figure 4.
Frequency of micronuclei in irradiated samples (0.1, 0.5 and 1 Gy from top to bottom). Tissues sliced into 2 mm wide stripes are reported in panels A while data relative to 1 mm and 0.5 mm wide stripes are shown on panels B and C respectively. As the directly irradiated area of the tissue is known within a few 100s micron precision, the stripes containing the directly irradiated cells are highlighted. The average level of background micronuclei as measured in the control samples (0.72 ± 0.37 % micronucleated cells) is also shown (dashed lines). Error bars indicate the standard error of the mean (SEM) for minimum N = 3 independent experiments. Data statistical significant from average control value indicated with * (p<0.05) and ** (p<0.01).

