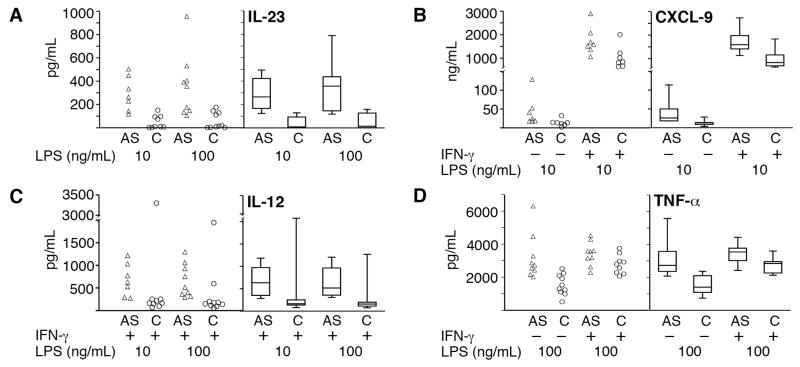
Figure 2. Increased IL-23, CXCL9, IL-12(p70) and TNF-α production in AS patient macrophages.
Individual sample data points are on the left and box plots showing median, 25th and 75th percentiles (boxes) and 10th and 90th percentiles (error bars) are on the right. A) IL-23: AS patient (AS, open triangles) or control samples (C, open circles) were treated with 10 or 100 ng/mL LPS for 24h. See Table 3 for associated p-values and numbers per group. B) CXCL-9: AS patient and control samples were left untreated (−) or treated with IFN-γ (+) for 24h, and then stimulated with 10 ng/mL LPS for another 24h. C) IL-12 (p70): All samples were pre-treated with IFN-γ for 24h and then stimulated with either 10 or 100 ng/mL LPS for another 8h. The outlier points for IL-12 production in response to both doses of LPS were from the same control subject. D) TNF-α: Macrophages were left untreated (−) or treated with IFN-γ (+) for 24h and then stimulated with 100 ng/mL LPS for 8h.

