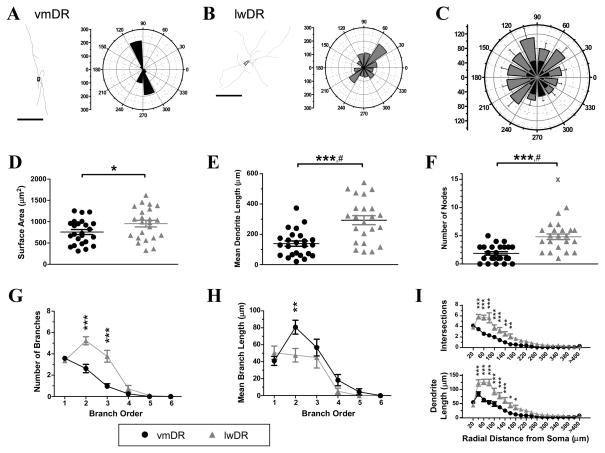
Figure 5.
The 5-HT neurons of the lwDR possess somatic and dendritic morphology that is distinct from vmDR neurons. A representative tracing demonstrates the morphology of a vmDR neuron (A) and an lwDR neuron (B) as generated by Neurolucida. The corresponding polar histogram to the right of the trace demonstrates the dendritic length in each direction, using 30-degree bins. Scale bar 100 μm. C) The polar histograms were averaged across groups to generate an average polar histogram, showing orientation preferences for dendrites of vmDR neurons (black) and lwDR neurons (grey). The longest dendrites of vmDR neurons were oriented in the dorsal-ventral direction while the longest dendrites of lwDR neurons did not show a particular preference. D) The 5-HT neurons of the lwDR had large cell soma surface area (t45= 2.05, P = 0.046). E) Mean dendritic length was longer in lwDR neurons (Student’s t test with Welch’s correction t35 = 4.46, P< 0.0001). # denotes a significant difference in varianceF22,23 = 2.73, P = 0.02. F)Neurons of the lwDR also had higher numbers of nodes, i.e. branch points (Student’s t test with Welch’s correction t35 = 5.07, P< 0.0001). # denotes a significant difference in variance F21,23 = 2.451, P = 0.04. G) The increased number of branches seen in lwDR neurons was limited to 2nd and 3rd order dendrites. H) The increased mean branch length of lwDR neurons was limited to 2nd order branches. I) Dendritic tree complexity was quantified by Sholl analysis, revealing that lwDR neurons had more intersections and longer dendritic length in the region ranging from 40 to 160 μm from the cell soma. For G-I, * P< 0.05, ** P< 0.01, *** P< 0.001 Bonferroni post tests. See Results for additional results of ANOVA tests. Outlying values denoted by the symbol “X” were not included in group means.

