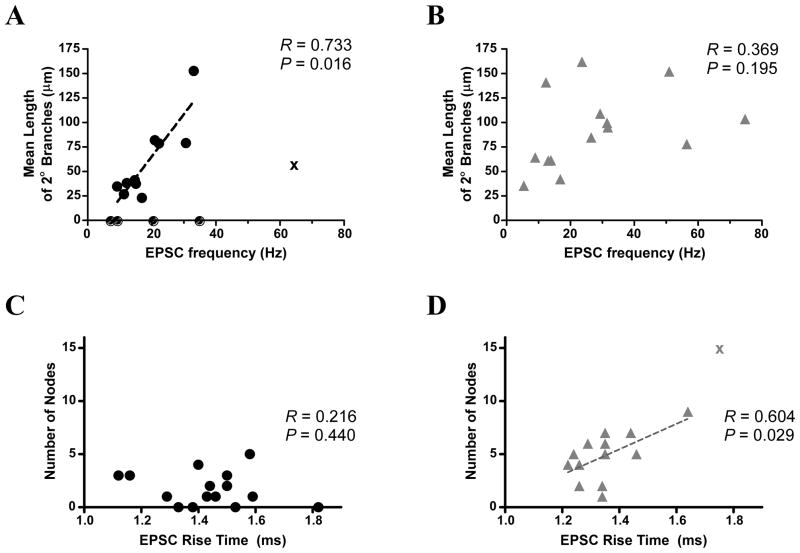
Figure 6.
Correlation analysis reveals several relationships between sEPSC parameters and morphological characteristics. A) A significant correlation was found between the mean length of 2nd order branches and sEPSC frequency among vmDR neurons. B) There was no correlation seen in lwDR neurons, suggesting that the increased branch length of lwDR neurons cannot account for the increased sEPSC frequency seen in all lwDR neurons. C) There was no correlation between sEPSC rise time and the number of nodes in vmDR neurons. D) However, there was a significant correlation between slow rise times and a larger number of nodes in lwDR neurons, suggesting increased electrotonic filtering in lwDR neurons. Correlations in (A) and (D) analyzed by Spearmantest; correlations in (B) and (C) analyzed by Pearson test. See Methods for details.

