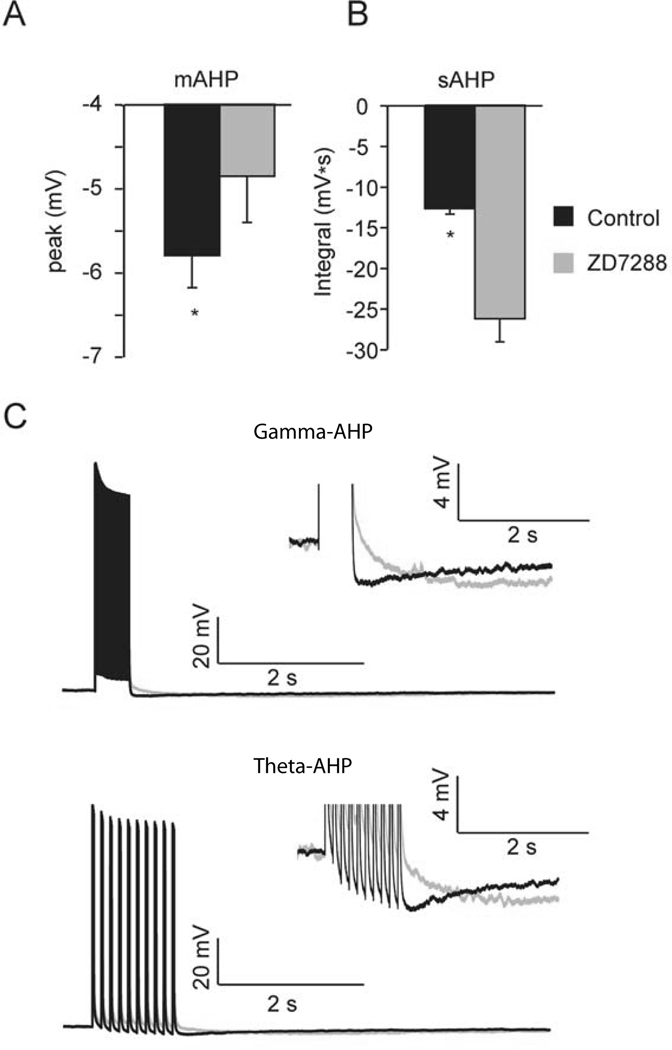
Figure 4. Ih contributes to the size and shape of the AHP.
A, Summary graph illustrates the peak of AHP is significantly reduced in ZD7288 (theta-AHP and train-AHP pooled for comparison, *p < 0.05). B, Summary graph illustrates the integral of AHP is significantly increased in ZD7288 (*p < 0.05). C, Top, representative trace of the train-AHP triggered in aCSF (black) superimposed on the train-AHP triggered in ZD7288 (grey). Inset shows train-AHP on an expanded scale. Bottom, representative trace of the theta-AHP triggered in aCSF (black) superimposed on the theta-AHP triggered in ZD7288 (grey). Inset shows theta-AHP on an expanded scale. Data from train-AHP and theta-AHP were similar, and pooled for comparison in shown in panel A.

