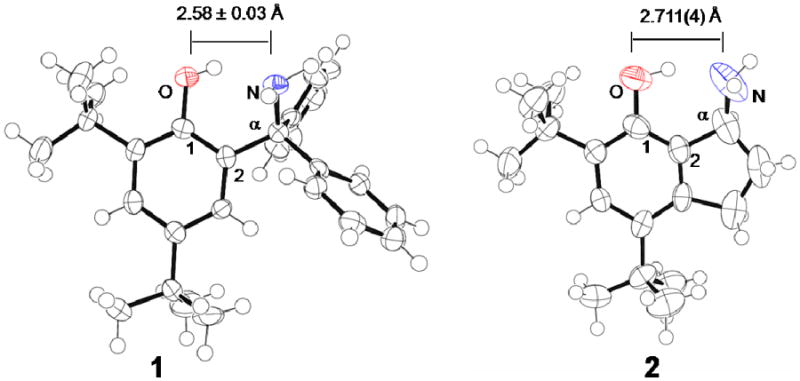
Figure 1.

ORTEPs, with crystallographic O⋯N distances, for phenols 119 and 2, ellipsoids drawn at 75% probability. For 1, the O⋯N distance listed is the average of the two independent molecules in the unit cell, which have distances that differ by 0.06 Å. Atom labels for relevant carbons used for the geometry discussion are given on the drawings.
