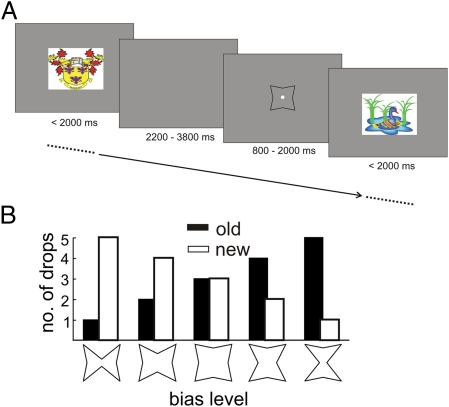
Fig. 2.
(A) Timing of the running recognition task. Images were presented on a computer screen, one at a time, with equally probable presentation of old and new images. (B) Response bias was pseudorandomly manipulated in blocks of 200 stimuli. The histogram shows the juice reward (in number of drops; y axis) obtainable for correct “old” (black) and correct “new” (white) responses as a function of the five experimental bias manipulations (x axis). The symbols at the bottom indicate the cues that were presented immediately before each image as a function of bias level in effect on that block (Methods, Behavioral Procedure).

