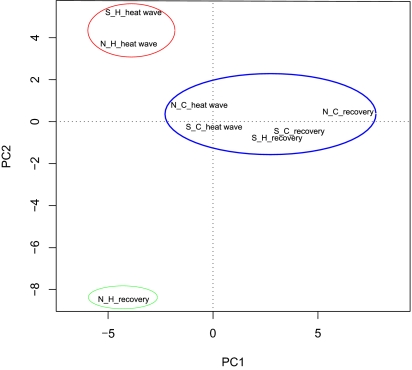
Fig. 1.
Multivariate grouping of experimental libraries based on the expression profiles of 1,872 TDE genes using PCA. TDE genes between heat and control treatment were assessed for four library combinations (southern vs. northern population; within vs. after heat wave). PCA was performed on the scaled expression matrix of genes (mean = 0; SD = 1). Populations: northern (N), southern (S); heat treatment (H), control treatment (C); time points: acute heat and recovery. Groupings are indicated by color: blue, expression during control conditions; red, expression during heat stress; green, divergent expression during early recovery. A list of all TDE genes is found in Table S3.

