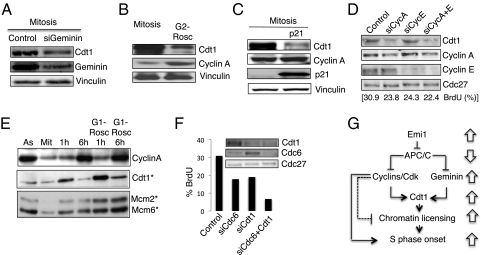
Fig. 5.
Geminin and Cdk activity amplify Cdt1 protein levels. (A) siRNA for Geminin is transfected 1 h after release from thymidine arrest and in the presence of Nocodazole for synchronization in mitosis 7 h later. Immunoblotting analysis for the indicated proteins is shown. Vinculin is used as a loading control. (B) Roscovitine treatment in the G2 phase blocks cell-cycle progression at G2/M transition with lower levels of Cdt1 protein. ES cells released for 1 h after thymidine block are treated with Cdk1/Cdk2 inhibitor Roscovitine or DMSO (control) and incubated for other 6 h in the presence of Nocodazole. Immunoblotting for the indicated proteins is shown. Vinculin is used as a marker of equal loading. (C) Cdt1 is decreased in mitosis when Cdk inhibitor p21 is expressed. Cells expressing p21 by Doxycycline treatment are used together with control cells (i.e. not treated with Doxycycline) and synchronized in mitosis. Immunoblotting analysis for the indicated proteins is shown. (D) Cyclin A depletion reduces levels of Cdt1. ES cells released for 1 h from thymidine arrest are treated with the indicated siRNA for 7 h in the presence of Nocodazole. The cells are then released from Nocodazole block and immunoblotting for the indicated proteins is performed with lysates from cells released for 1 h. BrdU incorporation was evaluated 2 h 45 min after Nocodazole release (15-min labeling). (E) Cdk activity during the G1 phase inhibits pre-RC formation. ES cells are synchronized in mitosis before release and treatment with Roscovitine during G1 phase. Immunoblotting analysis for the level of indicated proteins is shown. The asterisk represents the chromatin-containing fraction. (F) Cdt1 and Cdc6 drive fast G1 progression in ES cells. ES cells are synchronized in the S phase by thymidine treatment and released in presence of Nocodazole and siRNA for Cdt1 and Cdc6. Cells are then released from mitosis for 2 h 45 min with the last 15 min labeling with BrdU. Quantification of BrdU-positive cells is shown. (Inset) Immunoblotting analysis for levels of the indicated proteins in the siCdc6 or/and siCdt1 treated cells. (G) Model for the regulation of fast S phase entry in ES cells. Block arrows represent comparison with somatic cells.

