Fig. 3.
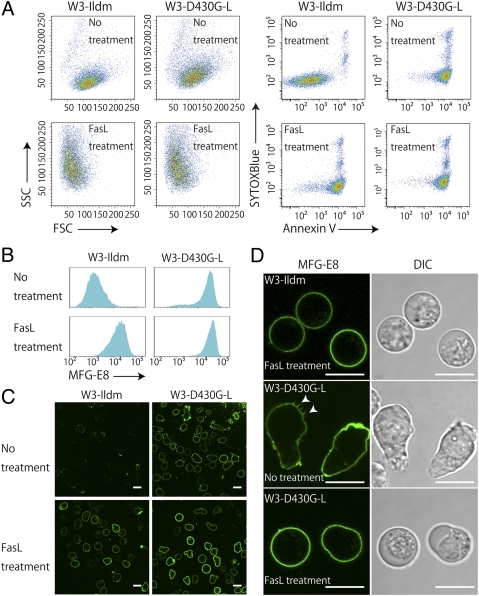
Exposure of phosphatidylserine on living W3-D430G-L cells. (A) W3-Ildm and W3-D430G-L cells with or without FasL treatment were stained with Cy5-labeled annexin V and Sytox blue and analyzed by flow cytometry. (Left four panels) FSC–SSC profile. (Right four panels) Profile for annexin V and Sytox blue staining. (B) W3-Ildm and W3-D430G-L cells with or without FasL treatment were stained with the FITC-labeled MFG-E8 and analyzed by FACS. The MFG-E8 staining profile in the Sytox blue− population is shown. (C and D) W3-Ildm and W3-D430G-L cells with or without FasL treatment were stained with FITC-labeled MFG-E8 and observed by confocal fluorescence microscopy. Images for MFG-E8 (green) and differential interference contrast (DIC) are shown. Arrowheads indicate microvilli. (Scale bar, 10 μm.)

