Fig. 5.
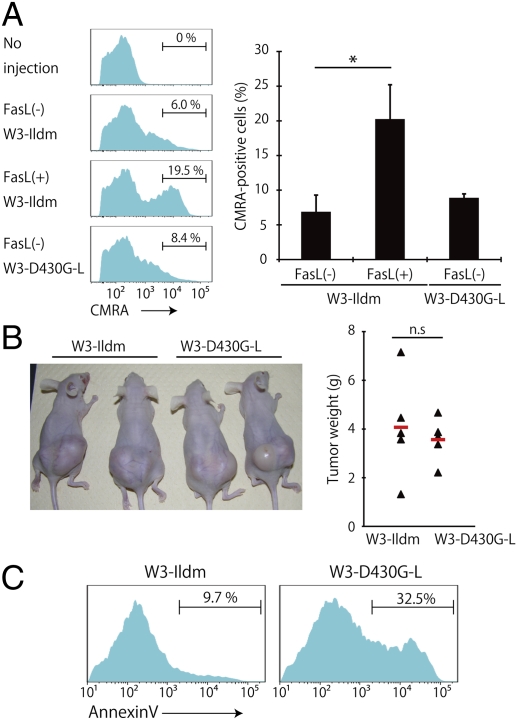
No clearance of the viable PS-exposing cells in vivo. (A) CMRA-labeled W3-Ildm and W3-D430G-L and FasL-treated W3-Ildm cells were injected into syngeneic female BALB/c mice. Thirty minutes after the injection, the splenic DCs were enriched by MACS sorting and analyzed by flow cytometry. The CMRA profile of the CD11c+CD8α+ population is shown. The percentages are of CMRA+ cells in the CD11c+CD8α+ population. Average values of three to four mice per group are shown with SD *P < 0.01. (B) Tumor development. W3-Ildm and W3-D430G-L cells (1.0 × 10⁶ cells) were transplanted s.c. into five BALB/c nude mice, respectively. Four weeks later, the tumors were dissected and their weight was determined. (Left) Picture of mice with tumors of the indicated cell line. (Right) Weights of tumors. The average values of the tumors from five mice are indicated by red horizontal bars. (C) PS exposure in the tumors developed in nude mice. Annexin V-staining profile of the Thy1.2+ tumor cells of the indicated cell line is shown. The number indicates the percentage of annexin V+ cells.

